
Guest post by David Kosub
After seeing the Riggs Park profile published by the Washington D.C. Economic Partnership, the Fort Totten Metro Station data intrigued me. And, yes, before you ask, there is nothing wrong with being intrigued by looking at administrative data held within public agencies! All the cool kids do it.
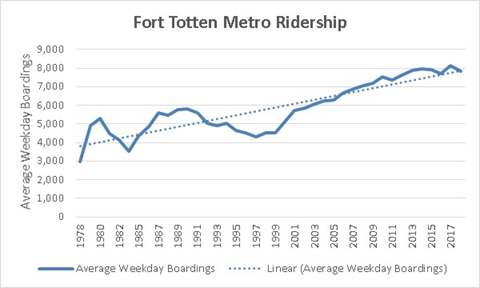
While searching the Public Records available on the Washington Metropolitan Area Transit Authority’s (WMATA’s) website, I did find a few nuggets of ridership data related to Fort Totten metro that I’d like to share (see the original source data here and my manipulations on this Excel sheet here). WMATA publishes historical ridership figures for each station going back to 1977, with Fort Totten coming online a year later (read these articles here and here to see how residents felt about it back then). Figure 1 displays the average number of weekday boardings per year at the Fort Totten station from 1978 to 2018 (data for 1983 were not available). Note, I assume “boardings” in Metro language refers to those who passed through a faregate, not simply transferred to another train (e.g., red line to green line). Boardings grew from 2,969 on an average weekday in 1978 to 7,842 four decades later. Note, these data represent actual average weekday boarding counts and not normalized to population change.
For kicks, let’s take a look at how Fort Totten compared to other stations across the system for average weekday boardings in 2018. As the table below shows, we clock in at number 25—not too shabby, especially when considering some of those other stations our weekday boarding numbers beat!
| Station | 2018*** | |
| 1 | Union Station | 28,315 |
| 2 | Metro Center | 24,532 |
| 3 | Gallery Pl-Chinatown | 22,613 |
| 4 | Farragut North | 22,184 |
| 5 | Farragut West | 20,348 |
| 6 | L’Enfant Plaza | 20,240 |
| 7 | Foggy Bottom-GWU | 18,299 |
| 8 | Dupont Circle | 16,542 |
| 9 | McPherson Square | 13,889 |
| 10 | Pentagon | 13,667 |
| 11 | Rosslyn | 13,020 |
| 12 | Pentagon City | 12,311 |
| 13 | Silver Spring | 11,682 |
| 14 | Shady Grove | 11,139 |
| 15 | Navy Yard-Ballpark | 11,013 |
| 16 | Crystal City | 10,795 |
| 17 | Columbia Heights | 10,448 |
| 18 | NoMa-Gallaudet U | 9,346 |
| 19 | Smithsonian | 9,331 |
| 20 | Ballston-MU | 9,029 |
| 21 | Bethesda | 8,999 |
| 22 | Vienna/Fairfax-GMU | 8,970 |
| 23 | Archives-Navy Memorial-Penn Quarter | 8,226 |
| 24 | Friendship Heights | 7,900 |
| 25 | Fort Totten (woot woot) | 7,842 |
| 26 | Wiehle-Reston East | 7,785 |
| 27 | Federal Triangle | 7,576 |
| 28 | Judiciary Square | 7,475 |
| 29 | King St-Old Town | 7,131 |
| 30 | Capitol South | 7,003 |
| 31 | Huntington | 6,896 |
| 32 | New Carrollton | 6,584 |
| 33 | Court House | 6,420 |
| 34 | Anacostia | 6,305 |
| 35 | Federal Center SW | 6,014 |
| 36 | Ronald Reagan Washington National Airport | 5,964 |
| 37 | Franconia-Springfield | 5,940 |
| 38 | Woodley Park-Zoo/Adams Morgan | 5,913 |
| 39 | Georgia Ave-Petworth | 5,889 |
| 40 | U St | 5,637 |
| 41 | Van Ness-UDC | 5,476 |
| 42 | Glenmont | 5,475 |
| 43 | Brookland-CUA | 5,436 |
| 44 | Rhode Island Ave-Brentwood | 5,417 |
| 45 | Greenbelt | 5,350 |
| 46 | Eastern Market | 5,303 |
| 47 | Tenleytown-AU | 5,286 |
| 48 | Branch Ave | 5,263 |
| 49 | Medical Center | 5,181 |
| 50 | Takoma | 5,033 |
| 51 | Grosvenor-Strathmore | 4,995 |
| 52 | Southern Avenue | 4,744 |
| 53 | Braddock Road | 4,376 |
| 54 | Clarendon | 4,375 |
| 55 | Shaw-Howard U | 4,314 |
| 56 | Suitland | 4,290 |
| 57 | Waterfront | 4,271 |
| 58 | Mt Vernon Sq 7th St-Convention Center | 4,238 |
| 59 | Largo Town Center | 4,181 |
| 60 | East Falls Church | 4,023 |
| 61 | Prince George’s Plaza | 4,012 |
| 62 | Twinbrook | 3,807 |
| 63 | Dunn Loring-Merrifield | 3,789 |
| 64 | Rockville | 3,756 |
| 65 | Virginia Square-GMU | 3,728 |
| 66 | Cleveland Park | 3,657 |
| 67 | College Park-U of Md | 3,650 |
| 68 | White Flint | 3,506 |
| 69 | Potomac Ave | 3,494 |
| 70 | Tysons Corner | 3,480 |
| 71 | Wheaton | 3,468 |
| 72 | West Hyattsville | 3,184 |
| 73 | Addison Road-Seat Pleasant | 2,652 |
| 74 | Benning Road | 2,604 |
| 75 | Van Dorn Street | 2,576 |
| 76 | West Falls Church-VT/UVA | 2,544 |
| 77 | Stadium-Armory | 2,423 |
| 78 | Naylor Road | 2,283 |
| 79 | Congress Heights | 2,223 |
| 80 | Minnesota Ave | 2,149 |
| 81 | Forest Glen | 2,045 |
| 82 | Eisenhower Avenue | 1,919 |
| 83 | Capitol Heights | 1,864 |
| 84 | McLean | 1,830 |
| 85 | Morgan Boulevard | 1,826 |
| 86 | Landover | 1,543 |
| 87 | Arlington Cemetery | 1,485 |
| 88 | Greensboro | 1,265 |
| 89 | Deanwood | 1,240 |
| 90 | Spring Hill | 1,203 |
| 91 | Cheverly | 980 |
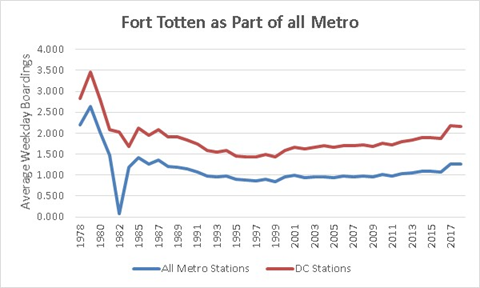
I next wondered how much of the total Metro daily boardings Fort Totten represented. To answer this, I looked at the proportion of Fort Totten boardings on an average weekday compared to (1) the system as a whole or (2) only those stations in the District. Please keep in mind that not every metro station open today (n=91) was around at the beginning (n=24), so ridership data can change substantively with each new station opening (amongst other factors).
Figure 2 displays these results. As a percentage of all of the stations in the system (lower line), Fort Totten started around 2.2 percent of all Metro boardings in 1978, fell to below 1 percent between 1992 and 2010, and began climbing thereafter rising to 1.3 percent in 2018. When focusing on only stations in the District (higher line), the trends are the same, starting at 2.8 percent in 1978, dipping down in the 1990s and 2000s, and rebounding thereafter to 2.3 percent in 2018.
So, what do these limited data tell us? Well, we can see the growth over time in the number of riders beginning their trips at Fort Totten on an average weekday. And, that is likely commensurate with multiple factors, such as changes and growth in D.C.’s population over time and more residents preferring public transportation to personal vehicles. Further, as compared to the system as a whole, it is exciting to see our numbers creep up in recent years, even when considering how many stations are open now compared to in 1978. To me, this shows a healthy use of the Fort Totten metro station on a daily basis—providing additional evidence that the nearby vicinity is ripe for robust transit-oriented development as called for in the 2009 Small Area Plan. My hope is that, when recruiting shops, restaurants, and other potential business owners to the neighborhood, we can use the additional evidence that our community is worth the investment.
